One particular figure is very commonly used when reliability is discussed: a bathtub curve. The bathtub curve shows the failure rate of a product as a function of time. Thus, it is a description of various failure rates for products over their lifetime. An example of a bathtub curve is shown below.
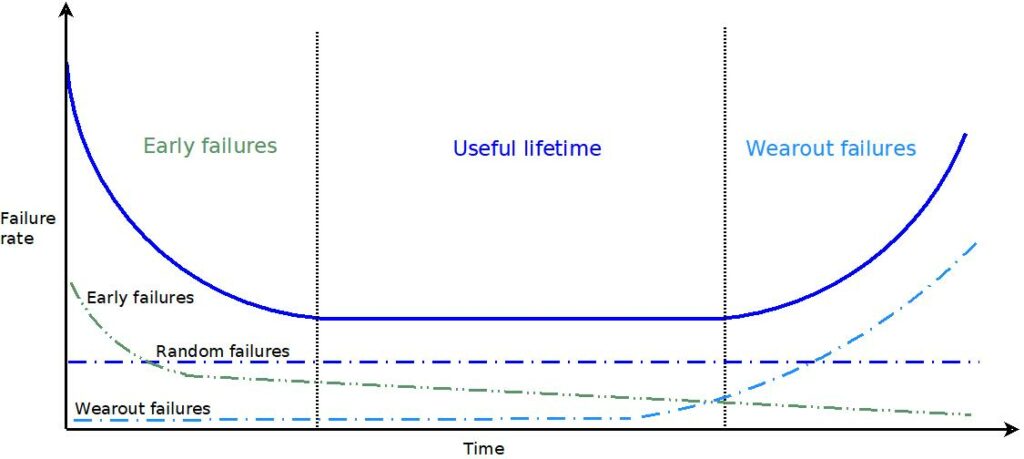
As can be seen, a bathtub curve consists of three different failure rates: decreasing failure rate, constant failure rate and increasing failure rate, which together form the curve shaped as a bathtub.
The first part of the curve describes early failures. At this stage a high number of failures is seen due to errors in design or manufacturing. The failure rate, however, is decreasing, because the products which have defects and are therefore failing fast are removed from the population.
The middle part of the curve describes the useful lifetime of a product. During this period the failure rate is constant. The failures seen are random failures, which can be caused for example due to random external stresses or mishandling of a product.
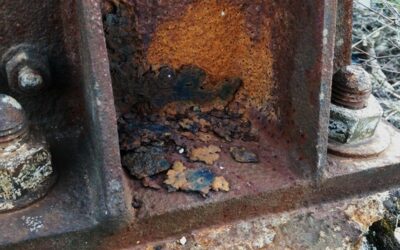
The last part of the curve describes the wearout failures of a product. At this stage the failure rate is increasing, as the aging of components and materials is accelerating the occurrence of failures. At this stage the failures can be caused for example due to corrosion, oxidation, or fatigue.
The first part of the curve is often called the period of infant mortality. This is because in addition to describing the failures in hardware population, the bathtub curve can also effectively describe the mortality of human population. Another name for the first part of the curve is burn-in, which brings us to the question of how reliability testing and the different parts of the bathtub curve are related?
Failures occurring in the first part of the curve can be at least partially found with burn-in or screening tests, in which a product is for example switched on to ensure its functionality or shortly tested with mild stress levels. The middle part of the curve should typically be rather long to ensure adequate use life. Various reliability test methods can be used to improve the performance of products and their components which prolongs the period of useful lifetime and postpones the occurrence of the wearout phase. Acceleration and harsher stress levels than those present at normal use environment are required in testing. Otherwise the failures will not occur in a reasonable test time.
Burn-in tests do not tell much about the reliability of the population of a product. They merely find the number of weak products in a population. They do not tell anything about the failures seen during the last part of the bathtub curve. When the reliability of products is tested, we recommend continuing testing until the majority of the tested samples have failed. This is especially important if the population has lots of early failures. Studying only the early failures may give misleading information of the actual wearout failures. Similarly, using only warranty data may cause similar problems.
As a final note to the bathtub curve it is important to notice, that the curve for an actual product may look very different from the one shown in the picture. For example, there may be a very few early failures or the failures due to wear may start very early and happen slowly causing the curve to increase slowly already during the useful lifetime. There are endless possibilities, but the simple bathtub curve is still a good tool to describe typical failure rate behaviour.